Chapter 13 — Monitoring Your Homelab and IoT Nodes
Before you can trust your IoT data, you need to know that your IoT nodes are running. Before you can trust your homelab, you need to know that your servers are healthy.
Monitoring the monitoring infrastructure is not recursive paranoia — it’s the practice that prevents “why did my plant die?” from having the answer “because the sensor node crashed 6 days ago and nobody noticed.”
Beszel: The Right Tool for Homelab Scale
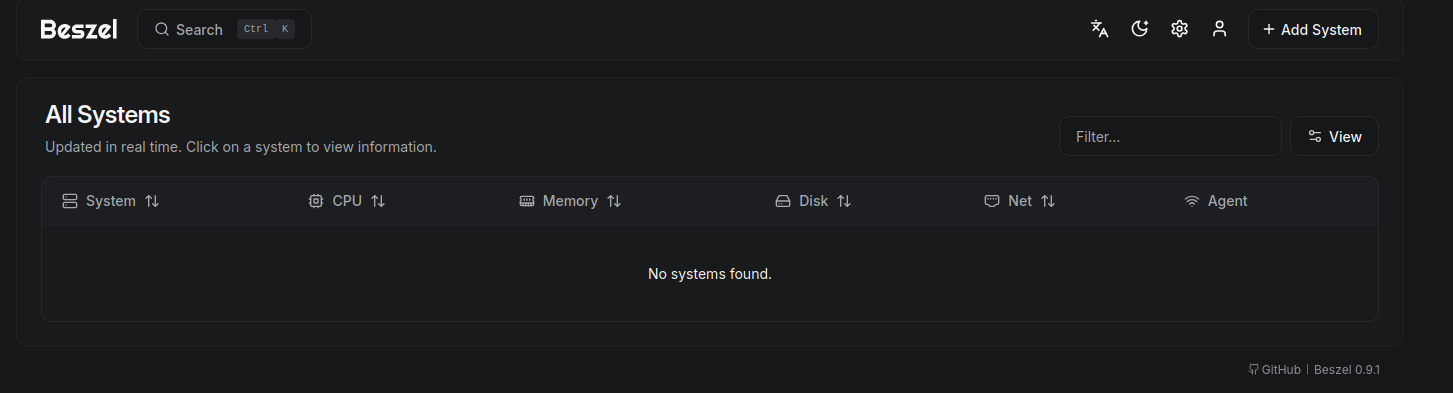
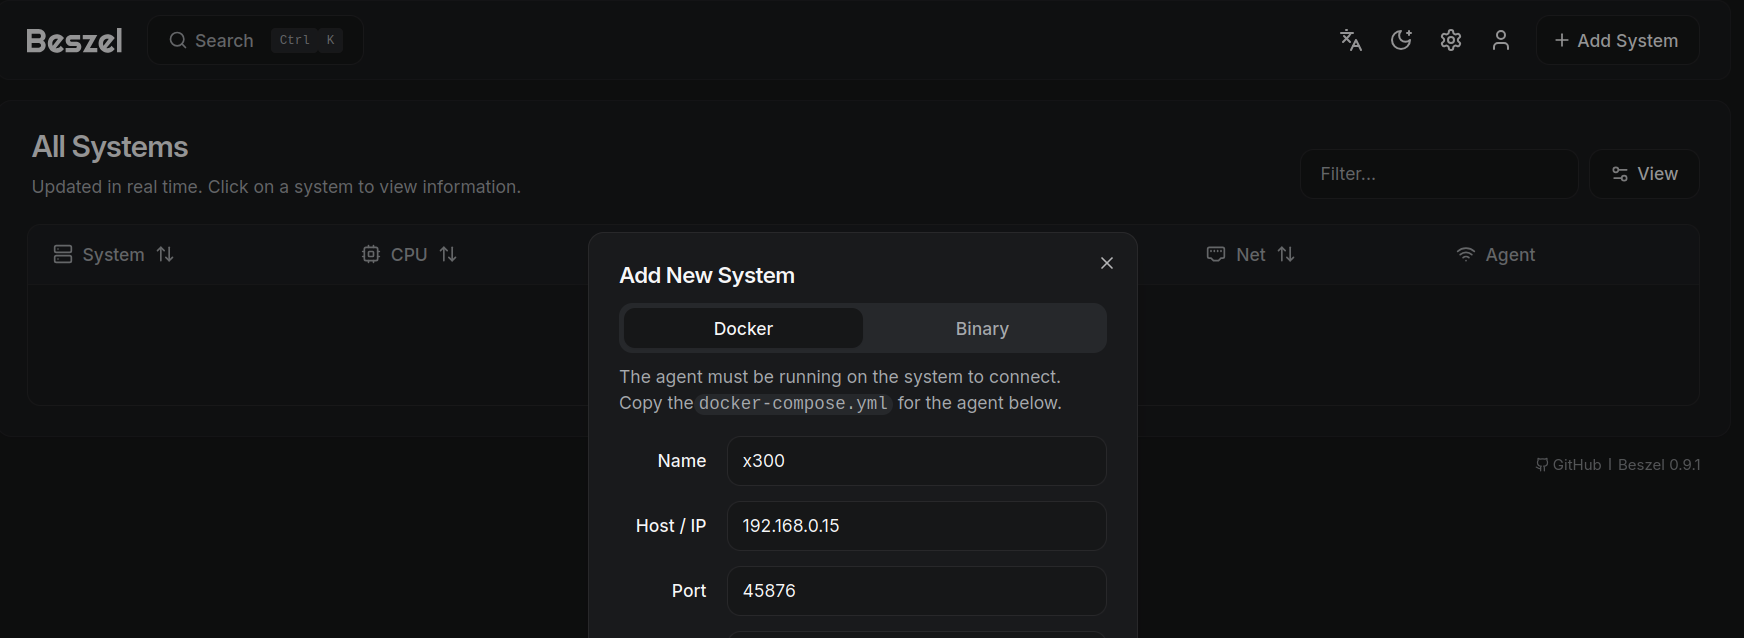
Beszel is a lightweight server monitoring tool that runs as a single binary (or Docker container) on each host. It tracks CPU, memory, disk, and network usage, and aggregates the data in a central Beszel Hub. The web UI is clean, responsive, and shows historical trends without requiring you to configure Prometheus scrape targets and Grafana dashboards.
For a homelab with 2–5 machines, Beszel is the right choice. Setup takes 10 minutes per host.
# docker-compose.yml for Beszel Hub
services:
  beszel:
    image: henrygd/beszel:latest
    ports:
      - "8090:8090"
    volumes:
      - ./beszel-data:/app/data
Netdata: Real-Time with More Detail
Netdata provides real-time metrics at per-second granularity with automatic detection of hundreds of applications. It’s more resource-intensive than Beszel but gives more detail when you need it — useful when you’re debugging a performance problem and need to know exactly which process spiked CPU 45 seconds ago.
Netdata also includes anomaly detection (comparing current behavior to historical baselines) which can catch unusual patterns before they become failures.
When to Graduate to the Full Grafana Stack
The full Prometheus + Grafana stack (Chapter 14) makes sense when:
- You have more than 5 nodes to monitor
- You need long-term retention (months of data for trend analysis)
- You want custom dashboards that combine homelab metrics with IoT sensor data in a single view
- You’re ready to spend a weekend on configuration
The Grafana stack is powerful but has a steep initial configuration curve. Beszel is the faster path to useful monitoring.
flowchart TD
    Start([New monitoring need]) --> Q1{How many nodes?}
    Q1 -->|1–5| Beszel[Beszel\n10 min setup, clean UI]
    Q1 -->|5+| Q2{Need custom dashboards?}
    Q2 -->|No| Netdata[Netdata\nReal-time, auto-detects apps]
    Q2 -->|Yes| Q3{IoT sensor data too?}
    Q3 -->|Yes| Influx[InfluxDB + Grafana\nTime-series first]
    Q3 -->|No| Prom[Prometheus + Grafana\nMetrics + PromQL]

    style Beszel fill:#e8f5e9,stroke:#388e3c
    style Netdata fill:#e3f2fd,stroke:#1565c0
    style Influx fill:#fff3e0,stroke:#e65100
    style Prom fill:#f3e5f5,stroke:#6a1b9a
Takeaway: Use Beszel for homelab monitoring at up to 5 nodes. Graduate to Prometheus + Grafana when you need custom dashboards, long-term retention, or more than 5 hosts.