Chapter 14 — Grafana and Prometheus: The IoT Data Stack
Grafana is the visualization layer. Prometheus is the metrics storage layer. Together they form the standard open-source observability stack — used at homelab scale and at the scale of large production systems.
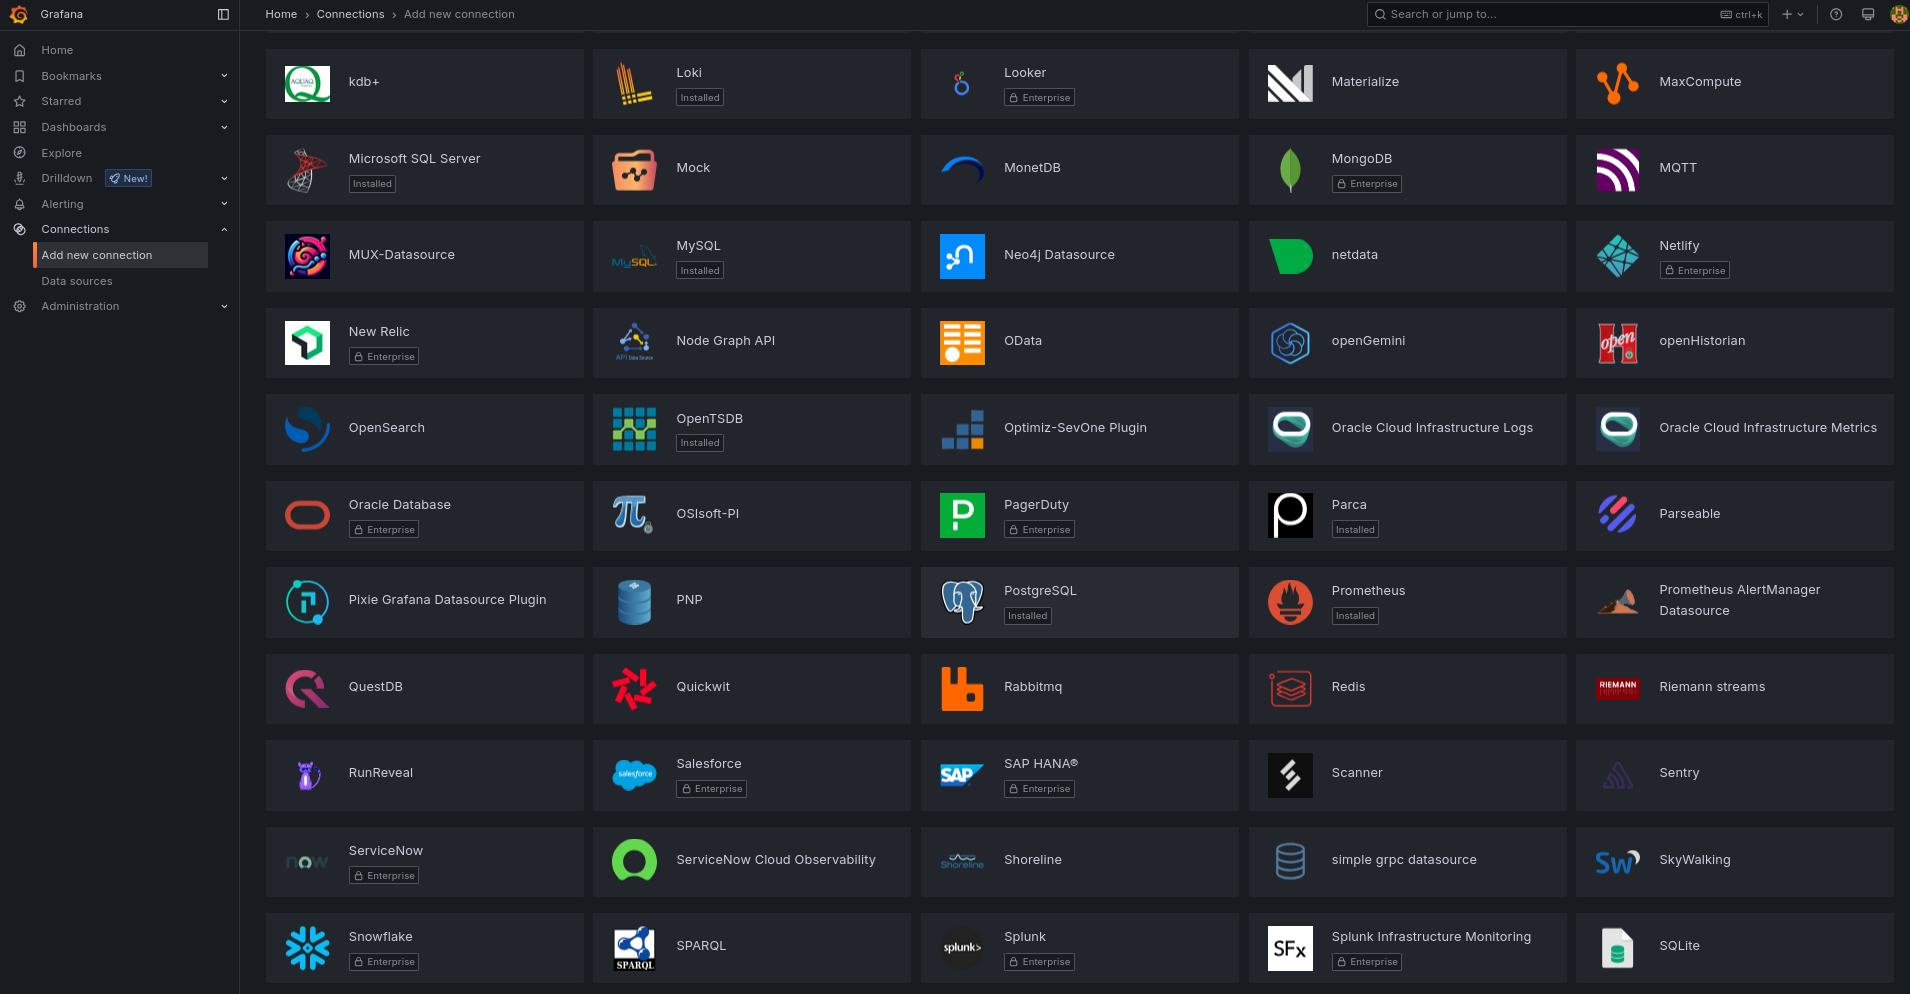
The reason to learn this stack even for a small homelab: the skills transfer. Understanding how Prometheus scrapes metrics, how to write PromQL queries, and how to build Grafana dashboards is genuinely useful beyond IoT.
Prometheus: How It Works
Prometheus uses a pull model: it periodically scrapes HTTP endpoints that expose metrics in a specific format. Each device or service you want to monitor runs an exporter — a small process that converts the native data format into Prometheus metrics.
For a Raspberry Pi: the node_exporter exposes CPU, memory, disk, and network metrics. For Docker containers: cAdvisor exposes per-container resource usage. For energy monitoring: the Iotawatt exporter pushes power consumption data.
# prometheus.yml
scrape_configs:
  - job_name: 'raspberry_pi'
    static_configs:
      - targets: ['192.168.1.100:9100']  # node_exporter

  - job_name: 'docker'
    static_configs:
      - targets: ['192.168.1.100:8080']  # cAdvisor
InfluxDB as an Alternative for IoT
Prometheus is optimized for metrics (numbers that change over time). InfluxDB is a time-series database designed specifically for IoT and monitoring data. It accepts arbitrary tag-based data over HTTP, making it easy to push sensor readings directly without an exporter.
From a Pico W or ESP32:
# Push to InfluxDB via HTTP
import urequests
payload = f"temperature,location=living_room value={temp}"
urequests.post("http://192.168.1.100:8086/write?db=sensors", data=payload)
For IoT sensor data specifically, InfluxDB + Grafana is often more natural than Prometheus + Grafana because sensors push data on their own schedule, while Prometheus expects to pull on its own schedule.
graph LR
    subgraph Edge["Edge Devices"]
        PicoW[Pico W]
        ESP32[ESP32]
        RPi[Raspberry Pi]
    end
    subgraph Storage["Storage"]
        Influx[(InfluxDB\nIoT sensor data\npush model)]
        Prom[(Prometheus\nHomelab metrics\npull model)]
    end
    PicoW -->|HTTP push\nline protocol| Influx
    ESP32 -->|HTTP push\nline protocol| Influx
    RPi -->|node_exporter\n:9100 scrape| Prom
    Influx --> Grafana[📊 Grafana]
    Prom --> Grafana

    style Influx fill:#fff3e0,stroke:#e65100
    style Prom fill:#e3f2fd,stroke:#1565c0
    style Grafana fill:#f3e5f5,stroke:#6a1b9a
Iotawatt: Energy Monitoring
Iotawatt is a hardware device (~€100) that clamps onto the mains circuits in your electrical panel and monitors power consumption for up to 14 circuits simultaneously. It exposes data via a local HTTP API and pushes to InfluxDB or Emoncms.
The result: a Grafana dashboard showing real-time and historical power consumption by circuit — the server rack, the kitchen appliances, the EV charger, the heat pump. The data typically reveals 2–4 circuits consuming significantly more than expected, with payback periods for efficiency improvements measurable in months.
Writing PromQL
Prometheus Query Language (PromQL) is how you extract meaning from raw metrics. Two queries worth knowing:
CPU usage over the last 5 minutes:
100 - (avg(rate(node_cpu_seconds_total{mode="idle"}[5m])) * 100)Available disk space as a percentage:
(node_filesystem_avail_bytes{mountpoint="/"} / node_filesystem_size_bytes{mountpoint="/"}) * 100The learning curve is real but not steep. Grafana’s query builder can generate PromQL for you until you’re comfortable writing it directly.
Takeaway: Prometheus + Grafana for homelab metrics. InfluxDB + Grafana for IoT sensor time-series. Iotawatt for circuit-level energy monitoring. PromQL is learnable in a weekend.